With the elections in full swing in 4 states of India – Kerala, West Bengal, Puducherry and Tamil Nadu, the whole nation is eager to know the results of the same. While Hyderabad is not one of those 4 states polling the elections, yet the startups of the city are not leaving any stone unturned to make a mark.
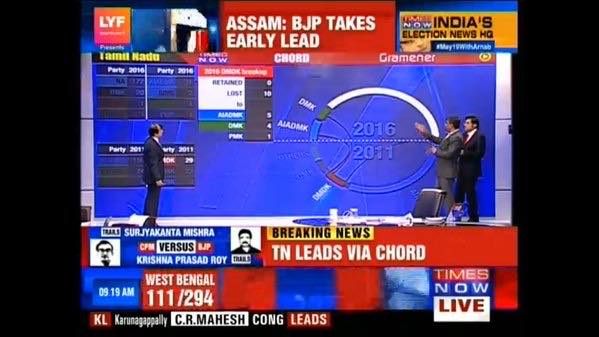
It was an extremely proud moment for the startup community in Hyderabad to have Gramener, a city based data visualization and Analytics Company team with up Times Now to give Indian viewers a never-seen-before cutting edge graphical representation of data.
Gramener is known to be the world leader in data visualization. They deal with large scale data via non – traditional analytics and work on it in such a way that it can finally be visualized in real – time. “Teaming up with India’s number one English news network is a great opportunity and challenge for us. We will introduce on May 19 a new genre of visual data journalism, which will make understanding data so much more simple.” Says Naveen Gattu, co-founder of this analytics company.

All thanks to this tie up, Times Now introduced some new-age data visualization tools including Spectrum, Firewall and Cluster on their #May19withArnab show. Arnab Goswami had quoted that “Election coverage will be an all new, refreshing experience on Times Now. By teaming with the world leader in data visualization Gramener, we will give Indian viewers never-seen-before cutting edge graphical representation of data.”

Together this team is going to introduce these visualization tools which is the very first time to happen in India and in the entire broadcast journalism world. The first is, ‘What If’? This will depict how each alliance is performing as the results trickle in and help examine various scenarios in terms of how future post-poll agreements may play out. Reports a news about the same news in TOI.
“The scatter plot”, just in our school time stats will show the different constituencies as per the margins of lead – the leads will be mapped on X – axis and the Y – axis will depict the vote shares. The “elections chord” will indicate which alliance/ party gathered in votes and seats at whose expense from the previous elections. “Spectrum”, will be used as a measurement tool to actually analyze as to how every seat traditionally votes. “Strike rate” will portray the performance of each party individually in terms of how many sets have they gained in comparison to the number of seats it actually contested for.
You can view the video here.
It was indeed a proud moment for the team at Gramener and the startup community in Hyderabad. Wishing the team more such laurels and success!


