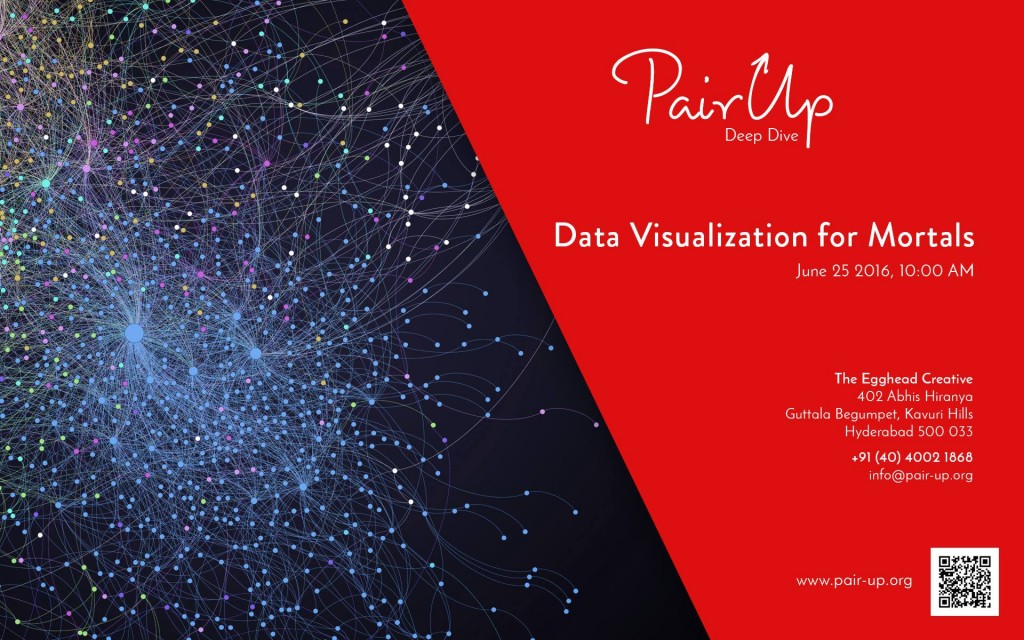
This analytical deep dive session will focus on data visualization and the best practices to keep in mind which can help you convert big data into meaningful insights. Data visualization is a very powerful tool in the hands of any data analyst, and if it’s done right, can be a very effective storytelling medium. Please make yourself comfortable with prerequisites before attending the event.
Prerequisites:Familiarity with atleast one of the data visualization tool such as Qlik, Tableau, Power BI etc
Introduction to Visualization and tools
- Objective of visualization
- Visualization tool overview – Power BI
- What is storytelling
Best practices in visualization
- Six principles of information design
- Understanding visual variables
- Visualization considerations
Hands down exercise on a data set
Applying the concepts learned on a small data set
Who should attend the event?
Data Analysts working with visualization tools, CXO’s & Product Managers and Aspiring Entrepreneurs.
Register Now Limited seats available.
Venue: The Egghead Creative Office, Abhis Hiranya, Madhapur, Hyderabad.
Date & Timings: June 25 2016, 10:00 AM to 02:00 PM

